Relevant Sales & Market News

* Data updates will take place every time a new sale is recorded
COE= Close of Escrow CDOM= Combined Days On Market $/Sqft = Price per Square Foot
Disclaimer: Based on information from California Regional MLS on Jun 15th 2026 at 1 am . This information above is for your personal, non-commercial use and may not be used for any purpose other than to identify prospective properties you may be interested in purchasing. Display of MLS data is usually deemed reliable but is NOT guaranteed accurate by the MLS. Buyers are responsible for verifying the accuracy of all information and should investigate the data themselves or retain appropriate professionals. Information from sources other than the Listing Agent may have been included in the MLS data. Unless otherwise specified in writing, Broker/Agent has not and will not verify any information obtained from other sources. The Broker/Agent providing the information contained herein may or may not have been the Listing and/or Selling Age
***** ADDITIONAL SALES NOT THROUGH THE MLS ******
- · 2023 W West Wind 3 BDR 2 BTH 2200 SF $1,070,000 11/08/24
- 3728 S Sea Breeze 2 BDR 2 BTH 1192 SF $782,000 8/30/24
- 3723 S Ocean Crest 2 BDR 2 BTH 1192 SF $850,000 8/15/24
- 3715 Sea Cliff 3BDR 2 BTH 1248 SF $ 855,000 7/23/24
- · 3701 S Sea Cliff 3 BDR 2 BTH 1601 SF $925,000 7/3/24
- 2008 W West Wind 3BDR 2 BTH 1406 SF $1,050,000 4/8/25
These above listed sales have occurred OUTSIDE the Multiple Listing Services, meaning that they have not been syndicated to the public via the MLS or any other on line portals that are intended to showcase property listings for wider exposure. Before choosing this type of approach to sale your home (Pocket Listing) it is important to understand that the reason behind comprehensive marketing, including listing the property in the MLS (which is probably the single best way of getting the word out to buyers and their agents) is:
- To reach that highest paying buyer (in the overall effort to reach every possible buyer)
- To orchestrate a competitive bidding situation, or at least the fear of impending competition in that buyer’s mind.
Without comprehensive marketing, it is much less likely that this “best” buyer will hear of your home being for sale in the first place; it is much less likely that a dynamic competitive bidding situation can be orchestrated. In either or both of those cases, it is quite possible you will sell your home for less, and perhaps significantly less, than you could have.

FREE COMPARATIVE MARKET ANALYSIS
Why is a comparative market analysis so important? Before selling or buying a home, it is vital that you know the home’s true market value in today’s ever-changing real estate market. Comparative market analysis (CMA) is essential as it's used to determine the value of a property through comparing similar property transactions located within a certain radius of your home for sale. A CMA will accurately establish a listing price for the seller and will guide buyers in deciding on a fair offer. As an agent, we know that conducting a thorough and professional CMA is critical to minimizing time on the market as well as ensuring that our clients receive or make an offer that is fair and reasonable.

Single Family Residences in Orange County
Charts are published based on data available at the end of Jan 2026, except for the today stats. All reports presented are based on data supplied by the Orange County MLS. Neither the Associations nor their MLSs guarantee or are in anyway responsible for their accuracy. Data maintained by the Associations or their MLSs may not reflect all real estate activities in the market. Information deemed reliable but not guaranteed.
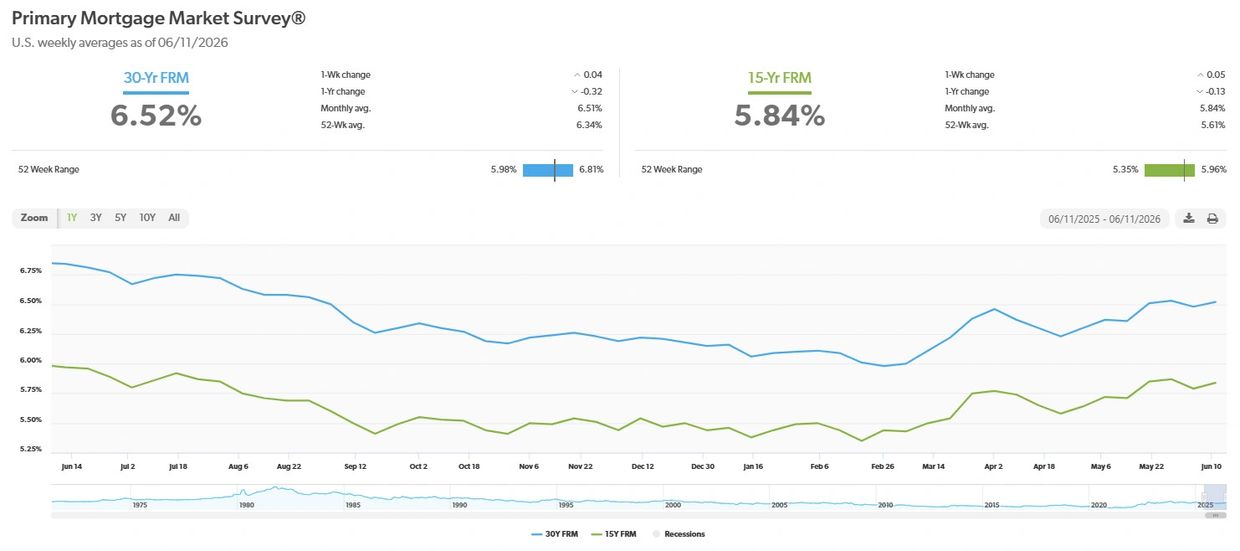
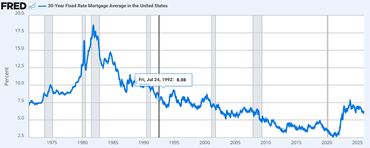
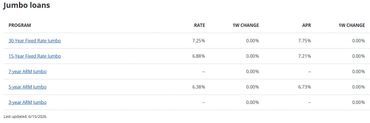
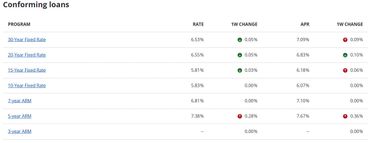
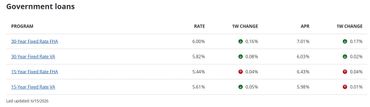
RATES CHART
Mortgage rates
Market News

OC June 2026 Market Briefs
Orange County Housing Summary
- INVENTORY: The active listing inventory in the past couple of weeks increased by 76 homes, up 2%, and now stands at 4,551. Last year, there were 4,645 homes on the market, 94 additional homes, or 2% more. The 3-year average before COVID (2017 to 2019) was 6,501, which is 43% higher. From January through May, 27% fewer homes came on the market than the 3-year average before COVID (2017 to 2019), 4,937 fewer. There were 489 fewer than last year, 1,556 more than in 2024, and 3,280 more than in 2023.
- DEMAND: Buyer demand, the number of pending sales over the prior month, decreased by 30 in the past two weeks, down 2%, and now stands at 1,637. Demand peaked a month ago. Last year, there were 1,633 pending sales, nearly unchanged. The 3-year average before COVID (2017 to 2019) was 2,766, which is 69% higher than today.
- MARKET TIME: With the inventory rising and demand falling, the Expected Market Time, the number of days to sell all Orange County listings at the current buying pace, increased from 81 to 83 days in the past couple of weeks. Last year, it was 85 days, similar to today. The 3-year average before COVID (2017-2019) was 71 days, faster than today.
- LUXURY: In the past two weeks, the Expected Market Time for homes priced between $2.5 million and $4 million increased from 128 to 140 days. For homes priced between $4 million and $6 million, the Expected Market Time increased from 177 to 229 days. For homes priced above $6 million, the Expected Market Time decreased from 295 to 239 days.
- DISTRESSED HOMES: Short sales and foreclosures combined, comprised only 0.3% of all listings and 0.2% of demand. Three foreclosures and nine short sales are available today in Orange County, bringing the total of distressed homes on the active market to nine, up three from 2 weeks ago. Last year, eight distressed homes were on the market, similar to today.
- CLOSED SALES: There were 1,886 closed residential resales in April, up 1% compared to April 2025’s 1,863 sales, and up 2% from March 2026. The sales-to-list price ratio in Orange County was 100.0%. There were no foreclosures, and short sales accounted for 0.1% of all closed sales. That means that 99.9% of all sales were sellers with equity.
June 2026 Market Trends
The headline numbers in Orange County remain stable, but the data underneath is worth looking at more carefully this week. Inventory crossed 4,800 for the first time this cycle. Closed sales pulled back to 431 from 476 last week. The $1,000,000 to $2,000,000 segment, which has been the most active price range all spring, saw days on market tick up from 31 to 33. None of these shifts are dramatic individually, but they are moving in the same direction.
On the rate environment, there are two developments markets are watching closely. First, progress on a potential Iran nuclear agreement. If a deal is reached and sanctions are eased, more Iranian oil would come to market. Lower oil prices reduce energy costs, which cools inflation, which gives the Federal Reserve more room to cut rates. That chain of events does not happen overnight, but it is a real pathway to lower mortgage rates if the diplomatic track holds.
Second, there is meaningful political pressure building toward rate cuts heading into the 2026 midterm elections. Markets are already pricing in the possibility of Fed action later this year. A new Fed chair is expected to face that pressure directly. Whether cuts materialize or not, the expectation of lower rates can itself influence buyer behavior. Buyers who are waiting for rates to drop before purchasing may begin to act on the anticipation rather than the reality.
Some high-volume lenders are still marketing rates under 6% on purchases and refinances depending on loan program and buyer profile. If you are sitting on the sidelines based on rate assumptions, it is worth a direct conversation with a lender before making that decision. I can direct you to the lenders with the best discounts.
The OC market continues to hold. Homes under $2,500,000 are selling just slightly below asking for the second week, by $6,746 or 0.5%. That number has barely moved week over week, which suggests a market that has found a short-term equilibrium rather than one that is sliding.
OC Apr/May 2026 Market Briefs
The Orange County housing market is operating in a normalizing, yet competitive, environment with the county-wide median home price sitting at approximately $1.29 million. Inventory is rising to give buyers more breathing room, but homes in high-demand brackets are still selling quickly over asking price.
Current Market Dynamics
- Rising Inventory: Active listings have seen an uptick over the last few weeks, bringing the total to over 4,200 active listings. This provides buyers with more options compared to the severe shortages seen earlier in the decade.
- Segment Variations: The most competitive speed is seen in detached single-family homes priced between $750,000\) and $1.5 million. Conversely, the luxury tier (homes over $2.5 million is seeing properties sell at discounts averaging about 5% below list price.
- Market Pace: The expected market time (days on market) is sitting around 80 days countywide, but highly desirable, well-priced properties in cities like Santa Ana and Orange are routinely selling in 40–50 days, often slightly above asking price.
- For Buyers: Although higher interest rates have tempered overall demand, competition remains for prime listings. However, the rising inventory means you do not have to settle as quickly and can negotiate more on certain property types.
- For Sellers: Pricing precision and home presentation matter immensely. Overpricing your home can result in lingering on the market, as buyers have more choices to compare against.
Orange County Housing Summary
- INVENTORY: The active listing inventory in the past couple of weeks increased by 168 homes, up 4%, and now stands at 4,475. Last year, there were 4,595 homes on the market, 120 additional homes, or 3% more. The 3-year average before COVID (2017 to 2019) was 6,370, which is 42% higher. From January through April, 25% fewer homes came on the market than the 3-year average before COVID (2017 to 2019), 3,530 fewer. There were 365 fewer than last year, 1,482 more than in 2024, and 2,832 more than in 2023.
- DEMAND: Buyer demand, the number of pending sales over the prior month, decreased by 11 in the past two weeks, down 1%, and now stands at 1,667. It appears demand peaked a couple of weeks ago. Last year, there were 1,621 pending sales, 3% fewer. The 3-year average before COVID (2017 to 2019) was 2,765, which is 65% higher than today.
- MARKET TIME: With the inventory rising and demand falling, the Expected Market Time, the number of days to sell all Orange County listings at the current buying pace, increased from 77 to 81 days in the past couple of weeks. Last year, it was 85 days, similar to today. The 3-year average before COVID (2017-2019) was 70 days, faster than today.
- LUXURY: In the past two weeks, the Expected Market Time for homes priced between $2.5 million and $4 million increased from 115 to 128 days. For homes priced between $4 million and $6 million, the Expected Market Time increased from 142 to 177 days. For homes priced above $6 million, the Expected Market Time increased from 281 to 295 days.
- DISTRESSED HOMES: Short sales and foreclosures combined, comprised only 0.2% of all listings and 0.4% of demand. Three foreclosures and six short sales are available today in Orange County, bringing the total of distressed homes on the active market to nine, down one from 2 weeks ago. Last year, four distressed homes were on the market, similar to today.
- CLOSED SALES: There were 1,886 closed residential resales in April, up 1% compared to April 2025’s 1,863 sales, and up 2% from March 2026. The sales-to-list price ratio in Orange County was 100.0%. There were no foreclosures, and short sales accounted for 0.1% of all closed sales. That means that 99.9% of all sales were sellers with equity.
OC Feb/Mar 2026 Market Briefs
As of March 2026, the Orange County housing market is transitioning into a more balanced spring environment, characterized by rising inventory and stabilized, yet high, home prices. The market has shifted away from the "frenzy" of previous years toward a more balanced state with increased choices for buyers
Orange County Housing Summary
- INVENTORY: The active listing inventory in the past couple of weeks increased by 156 homes, up 4%, and now stands at 3,687. Last year, there were 3,419 homes on the market, 268 fewer homes, or 7% less. The 3-year average before COVID (2017 to 2019) was 5,100, which is 38% higher. From January through February, 22% fewer homes came on the market than the 3-year average before COVID (2017 to 2019), 1,383 fewer. There were 238 fewer than last year, 684 more than in 2024, and 1,331 more than in 2023.
- DEMAND: Buyer demand, the number of pending sales over the prior month, increased by 97 in the past two weeks, up 6%, and now stands at 1,639. Last year, there were 1,665 pending sales, 2% more than today. The 3-year average before COVID (2017 to 2019) was 2,429, which is 48% higher.
- MARKET TIME: With demand increasing faster than supply, the Expected Market Time, the number of days to sell all Orange County listings at the current buying pace, decreased from 69 to 67 days in the past couple of weeks. Last year, it was 62 days, slightly faster than today. The 3-year average before COVID (2017-2019) was 63 days, also slightly quicker than today.
- LUXURY: In the past two weeks, the Expected Market Time for homes priced between $2.5 million and $4 million decreased from 126 to 123 days. For homes priced between $4 million and $6 million, the Expected Market Time decreased from 117 to 111 days. For homes priced above $6 million, the Expected Market Time increased from 262 to 330 days.
- DISTRESSED HOMES: Short sales and foreclosures combined, comprised only 0.2% of all listings and 0.2% of demand. Two foreclosures and five short sales are available today in Orange County, bringing the total of distressed homes on the active market to seven, up three from two weeks ago. Last year, four distressed homes were on the market, similar to today.
- CLOSED SALES: There were 1,364 closed residential resales in February, down 7% compared to February 2025’s 1,465 sales, and up 12% from January 2026. The sales-to-list price ratio in Orange County was 99.4%. Foreclosures accounted for 0.2% of all closed sales, and there were no short sales. That means that 99.8% of all sales were sellers with equity.
Key Trends & Observations
- Shift Toward Balance: The market is no longer defined by extreme scarcity, as inventory has increased compared to early 2025.
- Active Buyers: Despite higher rates compared to the 2020–2021 period, demand remains steady for available inventory.
- Luxury Resilience: Coastal and new construction luxury properties remain in high demand with limited inventory supporting high values.
- Slowdown in Financing: Development and new multi-family construction projects are facing constraints due to financing costs.
- Market Forecast: The spring 2026 market is expected to have healthy transaction volumes with stable to slightly appreciating prices, assuming inventory continues its gradual rise.
Market Segmentation
- Sellers: Benefit from continued low inventory compared to historical norms, but must price strategically due to increased buyer options.
- Buyers: Have more options than in previous years but still face affordability challenges, causing some to remain on the sidelines
January 2026 - Orange County Market Briefs
As of early February 2026, the Orange County, California, real estate market is transitioning into a more balanced, "Goldilocks" phase—defined as neither too hot nor too cold—characterized by rising inventory, stable but high prices, and a more competitive environment for sellers. Here is a breakdown of the Orange County market for January 2026:
Market Overview (January 2026)
- Inventory Surge: Active inventory hit 3,062 homes by mid-January, marking the highest level for that period since 2020.
- Price Adjustments: While still high, median list prices saw slight decreases compared to December 2025, with about 22% of listings reducing their price, providing more options for buyers.
- Market Speed: Homes are selling in a median of 55 to 63 days, taking slightly longer than the previous year.
- Demand: Buyer demand is returning after the holiday season, with purchase applications rising by 12% in late January.
- Outlook: The market is shifting away from the extreme, low-inventory conditions of 2024–2025 toward a more sustainable, steady pace.
Key Metrics
- Median List Price: Approximately $1.9 million (a slight dip from December 2025).
- Median Rent: Roughly $5,200/month.
- Inventory Levels: 3,062 active listings by mid-January 2026.
- Price Growth Forecast: Home prices are expected to continue rising, but at a more moderate 1%–4% pace in 2026.
Trends for Buyers and Sellers
- Buyers: Have more leverage and selection than in recent years, with a 13% increase in inventory in the first three weeks of January.
- Sellers: Must focus on strategic pricing and proper presentation. The market is no longer rewarding high prices for average, un-staged homes.
- Interest Rates: 2026 is seeing a "melting" of the "lock-in effect" as rates stabilize around 6%, allowing for more inventory to come onto the market.
Orange County Housing Summary
· INVENTORY: The active listing inventory in the past couple of weeks increased by 117 homes, up 4%, and now stands at 3,179. Last year, there were 2,821 homes on the market, 358 fewer homes, or 11% less. The 3-year average before COVID (2017 to 2019) was 4,695, which is 48% higher. In January, 15% fewer homes came on the market than the 3-year average before COVID (2017 to 2019), 466 fewer. Only 43 more sellers came on the market this January compared to January of last year, 534 more than in 2024, and 878 more than in 2023.
· DEMAND: Buyer demand, the number of pending sales over the prior month, surged by 350 in the past two weeks, up 38%, and now stands at 1,264. Last year, there were 1,340 pending sales, 6% more than today. The 3-year average before COVID (2017 to 2019) was 2,083, which is 65% higher.
· MARKET TIME: With demand surging compared to the smaller rise in supply, the Expected Market Time, the number of days to sell all Orange County listings at the current buying pace, plunged from 101 to 75 days in the past couple of weeks. Nonetheless, it is the highest end-of-January level since 2019. Last year, it was 63 days, faster than today. The 3-year average before COVID (2017-2019) was 70 days, similar to today.
· LUXURY: In the past two weeks, the Expected Market Time for homes priced between $2.5 million and $4 million decreased from 145 to 117 days. For homes priced between $4 million and $6 million, the Expected Market Time decreased from 249 to 170 days. For homes priced above $6 million, the Expected Market Time decreased from 365 to 267 days.
· DISTRESSED HOMES: Short sales and foreclosures combined, comprised only 0.1% of all listings and 0.5% of demand. Two foreclosures and two short sales are available today in Orange County, bringing the total of distressed homes on the active market to four, down two from two weeks ago. Last year, seven distressed homes were on the market, similar to today.
· CLOSED SALES: There were 1,641 closed residential resales in December, nearly identical to December 2024’s 1,634 sales, and up 10% from November 2025. The sales-to-list price ratio in Orange County was 98.0%. Foreclosures accounted for 0.1% of all closed sales, and short sales accounted for 0.1%. That means that 99.8% of all sales were sellers with equity.
December 2025 - Orange County Market Briefs
The Orange County housing market in December 2025 is experiencing a typical seasonal slowdown with lower new listings, but active buyers are still present, leading to a stable but cooling market with flat-to-modest price growth (median around $1.17M, up slightly YoY) and slightly longer days on market, while interest rates remain in the low 6s, with investor activity picking up in multifamily due to new tax incentives.
Key Takeaways for December 2025:
- Seasonal Shift: The market is slowing down for winter, with fewer sellers listing homes and a general cooling trend after a busy late summer/fall.
- Inventory: Active listings dropped as sellers paused, but demand is still present, keeping inventory from skyrocketing.
- Prices: Median prices are stable around $1.17M, showing minimal year-over-year growth (around 1.3%), with homes selling for slightly below list price (around 97.2%).
- Interest Rates: Rates are steady in the low 6s, with a slight downward trend expected into 2026.
- Buyer Activity: Despite fewer homes, buyers are still closing deals, though properties are sitting a bit longer (around 42 days on market).
- Investor Interest: Multifamily properties are seeing increased investor interest due to new tax benefits (like 100% bonus depreciation) and rising cap rates.
What to Watch For:
- The market is shifting to a more typical winter pattern, not necessarily a downturn.
- Expect demand to pick up again in the spring home buying season.
- While overall prices are stable, hot listings still sell fast
- Industrial property vacancy rates are rising slightly, with decreasing lease rates in some areas
Orange County Housing Summary
· INVENTORY: The active listing inventory in the past couple of weeks decreased by 98 homes, down 2%, and now stands at 4,478. Last year, there were 3,694 homes on the market, 784 fewer homes, or 18% less. The 3-year average before COVID (2017-2019) was 6,306, which is 41% higher. From January through September, 26% fewer homes came on the market compared to the 3-year average before COVID (2017-2019), 8,347 less. Yet, 2,221 more sellers came on the market this year than last, and 5,333 more compared to 2023.
· DEMAND: Buyer demand, the number of pending sales over the prior month, increased by 18 homes, up 1%, and now stands at 1,609, its highest level since the end of March. Last year, there were 1,591 pending sales, 3% lower than today. The 3-year average before COVID (2017-2019) was 2,262, which is 41% higher.
· MARKET TIME: With inventory and demand falling at a similar pace, the Expected Market Time, the number of days to sell all Orange County listings at the current buying pace, remained unchanged at 86 days in the past couple of weeks. It is the highest October level since 2019. Last year, it was 69 days, slightly faster than today. The 3-year average before COVID (2017-2019) was 87 days, similar to today.
· LUXURY: In the past two weeks, the Expected Market Time for homes priced between $2.5 million and $4 million increased from 148 to 151 days. For homes priced between $4 million and $6 million, the Expected Market Time decreased from 188 to 183 days. For homes priced above $6 million, the Expected Market Time increased from 334 to 431 days.
· DISTRESSED HOMES: Short sales and foreclosures combined, comprised only 0.2% of all listings and 0.3% of demand. Only four foreclosures and three short sales are available today in Orange County, with a total of seven distressed homes on the active market, down one from two weeks ago. Last year, five distressed homes were on the market, similar to today.
· CLOSED SALES: There were 1,805 closed residential resales in September, 11% higher than September 2024’s 1,622 sales, but down 4% from August 2025. The sales-to-list price ratio was 97.8% for Orange County. Foreclosures accounted for 0.2% of all closed sales, and there were no short sales. That means that 99.8% of all sales were sellers with equity.
September 2025 - Orange County Market Brief
In September 2025, the Orange County housing market showed a trend toward a more balanced market, marked by declining inventory, rising pending sales, and steady but slower closings. While demand is increasing with a rise in pending sales, the number of days to sell increased to around 90-94 days, which is slower than 2024 but still far from distressed. Seller pricing strategies are crucial, and the market is seeing a continued strength in the luxury segment.
Key market trends
- Inventory is tightening: Active listings dropped to 4,758 by late September 2025, the lowest since June and a 22% increase from last year, but still below the pre-COVID average.
- Demand is increasing: Pending sales were up 2% in the last two weeks of September, reaching the highest level for the month since 2022.
- Market time is increasing: Days on market rose to an average of 90-94 days, the slowest pace since 2018, though this is still considered "normal" compared to distressed periods.
- Closings are steady: August sales were nearly identical to last year, with a slight year-over-year increase in closed detached home sales.
- Luxury market is strong: Around 68 properties sold for over $2 million during the week of September 29, 2025, demonstrating continued strength in the high-end segment.
- Seller pricing is critical: With lower competition, sellers need to price their homes accurately to stand out.
- Buyers are navigating challenges: Affordability remains a key challenge, but lower rates are creating opportunities, especially for well-prepared buyers.
Orange County Housing Summary
· INVENTORY: The active listing inventory in the past couple of weeks decreased by 98 homes, down 2%, and now stands at 4,478. Last year, there were 3,694 homes on the market, 784 fewer homes, or 18% less. The 3-year average before COVID (2017-2019) was 6,306, which is 41% higher. From January through September, 26% fewer homes came on the market compared to the 3-year average before COVID (2017-2019), 8,347 less. Yet, 2,221 more sellers came on the market this year than last, and 5,333 more compared to 2023.
· DEMAND: Buyer demand, the number of pending sales over the prior month, increased by 18 homes, up 1%, and now stands at 1,609, its highest level since the end of March. Last year, there were 1,591 pending sales, 3% lower than today. The 3-year average before COVID (2017-2019) was 2,262, which is 41% higher.
· MARKET TIME: With inventory and demand falling at a similar pace, the Expected Market Time, the number of days to sell all Orange County listings at the current buying pace, remained unchanged at 86 days in the past couple of weeks. It is the highest October level since 2019. Last year, it was 69 days, slightly faster than today. The 3-year average before COVID (2017-2019) was 87 days, similar to today.
· LUXURY: In the past two weeks, the Expected Market Time for homes priced between $2.5 million and $4 million increased from 148 to 151 days. For homes priced between $4 million and $6 million, the Expected Market Time decreased from 188 to 183 days. For homes priced above $6 million, the Expected Market Time increased from 334 to 431 days.
· DISTRESSED HOMES: Short sales and foreclosures combined, comprised only 0.2% of all listings and 0.3% of demand. Only four foreclosures and three short sales are available today in Orange County, with a total of seven distressed homes on the active market, down one from two weeks ago. Last year, five distressed homes were on the market, similar to today.
· CLOSED SALES: There were 1,805 closed residential resales in September, 11% higher than September 2024’s 1,622 sales, but down 4% from August 2025. The sales-to-list price ratio was 97.8% for Orange County. Foreclosures accounted for 0.2% of all closed sales, and there were no short sales. That means that 99.8% of all sales were sellers with equity.
August 2025 - Orange County Market Brief
Market Briefs _ Aug/Sep 2025
9/22/2225
In August 2025, Orange County's real estate market is balanced but leaning towards buyers as demand softens and inventory increases modestly, with sellers needing to focus on pricing and presentation while buyers benefit from more options. More listings are appearing, providing more choices for buyers, though the market remains competitive and resilient.
Market Overview
- Shift in Balance: The market is shifting from being heavily seller-focused to a more balanced environment, with a slight tilt towards buyers.
- Rising Inventory: There's a modest increase in the number of homes on the market, providing more choices for potential buyers.
- Softening Demand: Buyer's demand is easing, contributing to the more balanced market conditions.
Advice for Sellers
- Strategic Pricing: Sellers should focus on pricing their homes competitively to attract buyers in the current market.
- Presentation: Home presentation remains crucial to stand out among the growing number of available listings.
Advice for Buyers
- Increased Options: Buyers have more choices and potentially better opportunities to find a suitable home.
- Mortgage Rates: Buyers may find it beneficial to take advantage of the increased options, especially if mortgage rates continue to fall.
MARKET IN NUMBERS
• INVENTORY: The active listing inventory in the past couple of weeks decreased by 111 homes, down 2%, and now stands at 4,758, its second largest drop of the year. After peaking on July 31", the inventory has continued to descend slowly. Last year, there were 3,695 homes on the market, 1,063 fewer homes, or 22% less. The 3•year average before COVIO (2017-2019) was 6,520, which is 37% higher. From January through August, 26% fewer homes came on the market compared to the 3-year average before COVID (2017-2019), 7,561 less. Yet, 2,281 more sellers came on the market this year than last, and 5,053 more compared to 2023.
• DEMAND: Buyer demand, the number of pending sales over the prior month, increased by 32 homes, up 2%, and now stands at 1,591. Last year, there were 1,413 pending sales, 11% lower than today. The 3-year average before COVID (2017-2019) was 2,363, which is 49% higher.
MARKET TIME: With inventory falling and demand rising, the Expected Market Time, the number of days to sell all Orange County listings at the current buying pace, decreased from 94 to 90 days in the past couple of weeks. its lowest level since June. Yet, it is still the highest mid-September level since 2018. Last year, it was 78 days, slightly faster than today. The 3-year average before COVID {2017-2019) was 84 days, which is also a bit quicker than today.
LUXURY: In the past two weeks, the Expected Market Time for homes priced between $2.5 million and $4 million decreased from 196 to 163 days. For homes priced between $4 million and $6 million, the Expected Market Time increased from 221 to 224 days. For homes priced above $6 million, the Expected Market Time decreased from 540 to 447 days.
• DISTRESSED HOMES: Short sales and foreclosures combined, comprised only 0.2% of all listings and 0.2% of demand. Only six foreclosures and three short sales are available today in Orange County, with a total of nine distressed homes on the active market. up two from two weeks ago. Last year, seven distressed homes were on the market, similar to today.
CLOSED SALES: There were 1,875 closed residential resales in August, nearly identical to August 2024's 1,877 sales, and down 3% from July 2025. The sales· to-list price ratio was 98.5% for Orange County. Foreclosures accounted for 0.2% of all closed sales. and short sales accounted for 0.1%. That means that 99.7% of all sales were sellers with equity
No Detectable Plunge
Orange County Housing Report: No Detectable Plunge
December 9, 2024
Housing data demonstrates that a significant drop in home values are not on the horizon despite the current market slowdown.
A Low Historical Supply
With a limited inventory and over a decade of tight lending standards, housing values will not plunge as they did during the Great Recession.
A surprising 44% of Americans thought the housing market would crash and values would plunge, according to a LendingTree survey conducted at the end of last year. A shocking 52% of millennials believed in a 2024 crash. The same study was conducted at the end of 2022, and 41% of Americans thought housing values would nosedive in 2023. The market did not collapse in either 2023 or 2024. How could so many convinced Americans get it wrong?
The Great Recession was a painful downturn for housing. So many homeowners were burned as values cratered and equity evaporated seemingly overnight. Everyone was affected by it personally or they knew someone who was painfully impacted and left with nothing. It was the most devastating period for housing since the Great Depression. As a result, the immediate knee-jerk response to any slowdown in housing is that values will tumble once again like they did during the Great Recession.
In 2018, when rates climbed from 4% to 5%, many believed that housing values would plunge. At the beginning of COVID, when the economy came to a screeching halt and many homeowners entered forbearance, the market was expected to tilt heavily in the buyer’s favor. And, when the Federal Reserve raised the Federal Funds Rate eleven times between March 2022 and July 2023, the housing bubble was supposed to pop. Yet, that did not occur.
There are many reasons that housing has not crashed over the years despite the continued sentiment that it was inevitable. There will not be a plunge in home values because there are simply not enough available homes to purchase. Today’s inventory is at 3,044 homes. While there are 40% more homes this year compared to last year, the 3-year average before COVID (2017 to 2019) was 4,988, 64% more than today.
The inventory has been stuck at anemic levels since the beginning of the pandemic. The difference is striking when comparing today’s supply to the two years leading up to the Great Recession, 2006 and 2007. The inventory peaked at 16,006 homes in 2006, and 17,898 in 2007. The 2023 peak was 2,496, and in 2024, it was 3,695. The inventory has remained at very low, anemic levels compared to the glut of available homes leading up to the Great Recession. The 3-year average peak prior to the pandemic was nearly 7,000, still considerably lower than the levels reached in 2006 and 2007.
In 2006, as demand plummeted and the inventory ballooned, the Expected Market Time (the number of days it takes to sell all Orange County listings at the current buying pace, based upon supply and demand) climbed to over 200 days. In 2007, when demand dropped even further, the Expected Market Time skyrocketed to over 400 days. When housing is severely out of balance, which it was prior to and during the Great Recession, values plunge.
Since the Federal Reserve raised the short-term rate, demand has plummeted to levels that rival the Great Recession. They have remained low since the second half of 2022. Yet, that low demand has been matched up against very little supply. Today’s Expected Market Time is 70 days, a far cry from 2006’s over 200 days and 2007’s over 400.
Even in today’s high mortgage rate environment, values have risen year-over-year. According to Freddie Mac’s House Price Index, the Los Angeles/Orange County metro has grown by 6% year-over-year through October. In 2023, home values rose by 8%. The low inventory has continued to place pressure on prices and has not allowed values to plunge despite severe affordability constraints.
Today’s United States housing stock is the strongest ever. Ever since the Great Recession, buyers have been purchasing homes with strict qualifications, strong credit, great jobs, and low fixed payments. There is record tappable equity (the amount of equity a homeowner can use for a loan while still retaining 20% equity), record equity rich (50% plus equity), and a record number of homeowners who own their home free-and-clear. There will be no housing crash because of the strength of the homeowner and the limited supply of homes available to purchase.
Active Listings
The inventory plunged by 9% in the past couple of weeks.
The active listing inventory decreased by 314 homes in the past two weeks, down 9%, and now sits at 3,044, its lowest level since the start of June. It was the largest drop so far this year. The inventory cyclically plunges during the Holiday Market. December is home to the fewest number of homes placed on the market and the greatest number of sellers who throw in the towel and pull their homes off the market due to a lack of success so that they can enjoy the holidays and wait for a better season to sell. Expect the inventory to continue to sink until ringing in a New Year.
Last year, the inventory was at 2,180 homes, 28% lower, or 864 fewer. The 3-year average before COVID (2017 through 2019) was 4,988, an additional 1,944 homes, or 64% more.
Homeowners continue to “hunker down” in their homes, unwilling to move due to their current underlying, locked-in, low fixed-rate mortgage. It became a crisis once rates skyrocketed higher in 2022. For November, 1,541 new sellers entered the market in Orange County, 713 fewer than the 3-year average before COVID (2017 to 2019), 32% less. Last November, there were 1,494 new sellers, 3% fewer than this year. More sellers are opting to sell compared to the previous year.
Demand
Demand dipped by 4% in the past couple of weeks.
Demand, a snapshot of the number of new pending sales over the prior month, decreased from 1,363 to 1,310 in the past couple of weeks, down 53 pending sales, or 4%, its lowest level since the start of February. While demand is continuing its seasonal drop until the New Year, it remains elevated compared to last year. Last year, rates were higher from September through December. Today’s better mortgage rate environment has paved the way for slightly higher demand, 18% higher or an extra 197 pending sales.
As the Federal Reserve has indicated, watching all economic releases for signs of slowing is essential. These releases can potentially move mortgage rates higher or lower, depending on how they compare to market expectations. The Consumer Price Index (CPI) will be released on Wednesday, and the Producer Price Index will be released on Thursday, two closely watched inflation gauges that can impact mortgage rates.
Last year, demand was 1,113, 197 fewer pending sales or 15% less. The 3-year average before COVID (2017 to 2019) was 1,774 pending sales, 35% more than today, or an additional 464.
With supply falling faster than demand, the Expected Market Time (the number of days it takes to sell all Orange County listings at the current buying pace) decreased from 74 to 70 days in the past couple of weeks. Last year, it was 59 days, faster than today. The 3-year average before COVID was 87 days, slower than today.
Luxury End
The luxury market slowed slightly in the past couple of weeks.
In the past couple of weeks, the luxury inventory of homes priced above $2 million (the top 10% of the Orange County housing market) decreased from 1,096 to 991 homes, down 105 or 10%. Luxury demand decreased by 31 pending sales, down 13%, and now sits at 207. With demand rising and the supply falling, the Expected Market Time for luxury homes priced above $2 million increased from 138 to 144 days. The luxury market has improved over the last couple of months due to the stock market reaching record levels.
Year over year, the active luxury inventory is up by 246 homes or 33%, and luxury demand is up by 74 pending sales or 56%. Last year’s Expected Market Time was 168 days, slower than today.
In the past two weeks, the expected market time for homes priced between $2 million and $4 million decreased from 104 to 76 days. For homes priced between $4 million and $6 million, the Expected Market Time decreased from 182 to 106 days. For homes priced above $6 million, the Expected Market Time increased from 359 to 380 days. At 380 days, a seller would be looking at placing their home into escrow around December 2025.
Orange County Housing Summary
· The active listing inventory in the past couple of weeks plunged by 314 homes, down 9%, and now sits at 3,044, its lowest level since the start of June and its largest drop of the year. In November, 32% fewer homes came on the market compared to the 3-year average before COVID (2017 to 2019), 713 less. Yet, 47 more sellers came on the market this November compared to November 2023. Last year, there were 2,180 homes on the market, 864 fewer homes, or 28% less. The 3-year average before COVID (2017 to 2019) was 4,988, or 64% extra.
· Demand, the number of pending sales over the prior month, decreased by 53 pending sales in the past two weeks, down 4%, and now totals 1,310. Last year, there were 1,113 pending sales, 15% fewer. The 3-year average before COVID (2017 to 2019) was 1,774, or 35% more.
· With supply falling faster than demand, the Expected Market Time, the number of days to sell all Orange County listings at the current buying pace, decreased from 74 to 70 days in the past couple of weeks. The 3-year average before COVID (2017 to 2019) was 87 days, slower than today.
· In the past two weeks, the Expected Market Time for homes priced below $750,000 increased from 57 to 58 days. This range represents 19% of the active inventory and 23% of demand.
· The Expected Market Time for homes priced between $750,000 and $1 million decreased from 60 to 49 days. This range represents 15% of the active inventory and 22% of demand.
· The Expected Market Time for homes priced between $1 million and $1.25 million decreased from 47 to 45 days. This range represents 9% of the active inventory and 14% of demand.
· The Expected Market Time for homes priced between $1.25 million and $1.5 million decreased from 57 to 45 days. This range represents 11% of the active inventory and 13% of demand.
· The Expected Market Time for homes priced between $1.5 million and $2 million decreased from 91 to 56 days. This range represents 14% of the active inventory and 12% of demand.
· In the past two weeks, the expected market time for homes priced between $2 million and $4 million decreased from 104 to 76 days. For homes priced between $4 million and $6 million, the Expected Market Time decreased from 182 to 106 days. For homes priced above $6 million, the Expected Market Time increased from 359 to 380 days.
· The luxury end, all homes above $2 million, account for 30% of the inventory and 16% of demand.
· Distressed homes, both short sales and foreclosures combined, comprised only 0.2% of all listings and 0.2% of demand. Only four foreclosures and two short sales are available today in Orange County, with six total distressed homes on the active market, unchanged from two weeks ago. Last year, six distressed homes were on the market, identical to today.
· There were 1,842 closed residential resales in October, up 13% compared to October 2023’s 1,632 and up 14% from September 2024. The sales-to-list price ratio was 100.0% for Orange County. Foreclosures accounted for 0.1% of all closed sales, and there were no short sales. That means that 99.9% of all sales were good ol’ fashioned sellers with equity.
A Successful Approach
Orange County Housing Report: A Successful Approach
November 12, 2024
With so many varying viewpoints and narratives swirling about the housing market, it is best to take a step back from the noise and focus on the latest trends.
Meticulously Arriving at Price
Setting an accurate, initial asking price is one of the most critical steps in a seller securing an interested buyer and achieving a successful outcome of the sale of their home.
It takes months of preparation and a detailed step-by-step approach for anyone looking to run a marathon for the first time. Most marathon training plans range from 12 to 20 weeks, with the weekly mileage ramping up steadily until peaking at 20+ mile runs. The long, arduous process includes proper nutrition, appropriate footwear, plenty of stretching, good rest, and putting in miles and miles of workouts three to five times per week. The occasional runner who opts to show up to the starting line of their first marathon with very little training and forethought will probably not finish, and the risks of injury are high.
For the homeowner looking to sell their home, it takes careful preparation and a step-by-step approach, just like the first-time marathoner. Addressing deferred maintenance, from a fresh coat of paint to new light fixtures to new flooring, is essential in enhancing a home’s allure. Sprucing up the curb appeal with topsoil, flowers, new plants, and a fresh coat of paint on the garage and front doors may be an additional necessary step. This attention to detail is often suggested by a seasoned, carefully chosen, professional REALTOR®. The goal is to maximize a seller’s net proceeds with a successful closed sale. The final and most important crucial step is to arrive at the asking price.
Arriving at the ultimate asking price is not guesswork. There is no need to pad the price for future negotiations, which will ultimately lead to becoming overpriced without success. Additionally, sellers wishing to “test the market” in today’s much slower-paced housing market will languish for quite some time, unable to cross the finish line. The best approach is to spend as much time as is needed to carefully consider all recent pending and closed sales.
Buyers are savvy. They will scrutinize every detail of a home before climbing in a car to take a closer look at a home: the pictures, virtual tours, condition, upgrades, amenities, style, curb appeal, age, location, and, most importantly, its price. Price is the most critical first impression. Sellers only get one shot at making that first impression. After the initial seven to ten days, most buyers have “seen” the home. Armed with their favorite real estate app, they initially tour the home electronically. They then decide to either schedule a showing appointment or move on and wait for the next home that pops up. The longer a home is on the market, the less fanfare and excitement it receives. Even if a seller reduces the asking price down the road, it is not met with eager buyer anticipation and enthusiasm like it does when it first hits the market. Currently, 35% of today’s active listing inventory has reduced the asking price at least once.
Yet, the data illustrates that starting overpriced, requiring a reduction to secure success, results in the seller walking away with a smaller net proceeds check. The sales price to last list price ratio is very revealing. This refers to the final list price before becoming a pending sale. These are averages, meaning there are exceptions, but the overall trend is eye-opening. In Orange County, 72% of all closed sales in October did not reduce the asking price. It was 88% in May. The sales price to last list price ratio for these homes was 99.3%, meaning, on average, a home appropriately priced sold close to its initial asking price. A house listed at $1 million sold for $993,000, $7,000 below the asking price. The median days on the market before becoming a pending sale was only 11, indicating that accurate pricing also means considerably less time on the market.
13% of all closed sales reduced their asking prices between 1% and 4%. The sales-to-last list price ratio for these homes was 97.6%; on average, it took 48 days to become a pending sale. A house that reduced its list price to $1 million sold for $976,000, a substantial $17,000 less than homeowners with no reduction.
For homes that reduced their asking prices by 5% or more, 15% of closed sales in October, the sales-to-last list price ratio was 95.8% after being on the market for 59 days. A home that finally reduced its price to $1 million sold for $958,000, a staggering $35,000 less than homeowners who did not need to reduce the asking price.
The sales price to original list price ratio reveals how far off many sellers are in considering a home’s actual market value. This is the price of a home when it initially comes on the market before any price reductions. For homes that reduced the asking price between 1% to 4%, the sales price to original list price ratio was 94.8%. For example, a house initially listed at $1,030,000 had to reduce the asking price to $1 million to secure success and ultimately sold for $976,000, an astonishing $54,000 less the original price.
Homes that reduced the asking price by at least 5% had a sales-to-original list price ratio of 86.3%. A house initially listed at $1,110,000 had to lower the asking price, often more than once, to $1 million to find success, and ultimately sold for $958,000. That is an overwhelming $152,000 less than the original asking price.
The data is loud and clear. For sellers to net as much as possible at the closing table, it is essential to carefully arrive at a home’s Fair Market Value no matter how much time and effort it takes. It is wiser to spend hours sifting through all the most recent comparable pending and closed sales, carefully considering a home’s condition, upgrades, amenities, and location, than to linger on the market without success, left with a decision to reduce the asking price or throw in the towel and pull the home off the market. In other words, the most successful home-selling approach is meticulously arriving at the initial asking price.
Active Listings
The inventory will continue to fall until the beginning of the New Year.
The active listing inventory decreased by 124 homes in the past two weeks, down 3%, and now sits at 3,516, its lowest level since mid-August and its largest drop of the year. The inventory peak in Orange County for 2024 occurred four weeks ago at 3,694, 48% higher than last year’s November 9th peak. Expect the inventory to continue to fall for the remainder of the year. It will fall faster starting next week, the start of the Holiday Market, just a week before Thanksgiving. The New Year will start similar to 2023, with around 2,400 homes. The three-year average start to the year before COVID (2017 to 2019) was 4,550.
Last year, the inventory was 2,496 homes, 29% lower, or 1,020 fewer. The 3-year average before COVID (2017 through 2019) was 5,822, an additional 2,306 homes, or 66% more.
Homeowners continue to “hunker down” in their homes, unwilling to move due to their current underlying, locked-in, low fixed-rate mortgage. It became a crisis once rates skyrocketed higher in 2022. For October, 2,377 new sellers entered the market in Orange County, 626 fewer than the 3-year average before COVID (2017 to 2019), 21% less. Last October, there were 1,891 new sellers, 20% fewer than this year. More sellers are opting to sell compared to the previous year.
Demand
Demand plunged by 7% in the past couple of weeks.
Demand, a snapshot of the number of new pending sales over the prior month, plunged from 1,572 to 1,458 in the past couple of weeks, down 235 pending sales, or 7%. This reflects rates climbing from 6.1% in mid-September to 7.13% on November 6th, up more than 1%. This rise was due to economic readings that were stronger than expected, along with investors’ election positioning. The higher rate environment has eroded demand due to affordability issues. Rates were stuck above 7% again for 9 days. They have since retreated, falling below the 7% threshold, and currently sit at 6.92%. Expect demand to continue to fall through the end of the year. The speed of the drop totally depends upon what happens to mortgage rates from here.
As the Federal Reserve has indicated, it is essential to watch all economic releases for signs of slowing. These releases can potentially move mortgage rates higher or lower, depending on how they compare to market expectations. This week will include two different inflation prints, the Consumer Price Index (CPI) and the Producer Price Index (PPI). In addition, retail sales will be released on Friday.
Last year, demand was 1,223, down 235 pending sales or 16%. The 3-year average before COVID (2017 to 2019) was 2,139 pending sales, 47% more than today, or an additional 681.
With demand falling faster than supply, the Expected Market Time (the number of days it takes to sell all Orange County listings at the current buying pace) increased from 69 to 72 days in the past couple of weeks. Last year, it was 61 days, faster than today. The 3-year average before COVID was 85 days, slower than today.
Luxury Market
The luxury market slowed in the past couple of weeks.
In the past couple of weeks, the luxury inventory of homes priced above $2 million (the top 10% of the Orange County housing market) decreased from 1,177 to 1,138 homes, down 39 or 3%. Luxury demand decreased by 16 pending sales, down 7%, and now sits at 212, its lowest reading since February. With demand dropping faster than supply, the Expected Market Time for luxury homes priced above $2 million increased from 155 to 161 days, its highest reading since the first week of January. The luxury market is sluggish and necessitates a careful, methodical approach to pricing.
Year over year, the active luxury inventory is up by 319 homes or 39%, and luxury demand is up by 50 pending sales or 31%. Last year’s Expected Market Time was 152 days, similar to today.
In the past two weeks, the expected market time for homes priced between $2 million and $4 million increased from 113 to 123 days. For homes priced between $4 million and $6 million, the Expected Market Time decreased from 240 to 217 days. For homes priced above $6 million, the Expected Market Time decreased from 346 to 322 days. At 346 days, a seller would be looking at placing their home into escrow around September 2025.
Orange County Housing Summary
• The active listing inventory in the past couple of weeks decreased by 124 homes, down 3%, and now sits at 3,516, its lowest level since mid-August and its largest drop of the year. Orange County reached its annual peak at 3,694 homes four weeks ago. In October, 21% fewer homes came on the market compared to the 3-year average before COVID (2017 to 2019), 743 less. Yet, 486 more sellers came on the market this September compared to September 2023. Last year, there were 2,496 homes on the market, 1,020 fewer homes, or 29% less. The 3-year average before COVID (2017 to 2019) was 5,822, or 66% extra.
• Demand, the number of pending sales over the prior month, decreased by 114 pending sales in the past two weeks, down 7%, and now totals 1,458. Last year, there were 1,223 pending sales, 16% fewer. The 3-year average before COVID (2017 to 2019) was 2,139, or 47% more.
• With demand falling faster than supply, the Expected Market Time, the number of days to sell all Orange County listings at the current buying pace, increased from 69 to 72 days in the past couple of weeks. The 3-year average before COVID (2017 to 2019) was 85 days, slower than today.
• In the past two weeks, the Expected Market Time for homes priced below $750,000 increased from 52 to 54 days. This range represents 17% of the active inventory and 23% of demand.
• The Expected Market Time for homes priced between $750,000 and $1 million increased from 46 to 53 days. This range represents 15% of the active inventory and 20% of demand.
• The Expected Market Time for homes priced between $1 million and $1.25 million decreased from 52 to 50 days. This range represents 11% of the active inventory and 15% of demand.
• The Expected Market Time for homes priced between $1.25 million and $1.5 million increased from 57 to 62 days. This range represents 11% of the active inventory and 13% of demand.
• The Expected Market Time for homes priced between $1.5 million and $2 million decreased from 76 to 73 days. This range represents 14% of the active inventory and 14% of demand.
• In the past two weeks, the expected market time for homes priced between $2 million and $4 million increased from 113 to 123 days. For homes priced between $4 million and $6 million, the Expected Market Time decreased from 240 to 217 days. For homes priced above $6 million, the Expected Market Time decreased from 346 to 322 days.
• The luxury end, all homes above $2 million, account for 32% of the inventory and 15% of demand.
• Distressed homes, both short sales and foreclosures combined, comprised only 0.3% of all listings and 0.1% of demand. Only seven foreclosures and two short sales are available today in Orange County, with nine total distressed homes on the active market, up two from two weeks ago. Last year, six distressed homes were on the market, similar to today.
• There were 1,622 closed residential resales in September, down 2% compared to September 2023’s 1,647 and down 14% from August 2024. The sales-to-list price ratio was 98.9% for Orange County. Foreclosures accounted for 0.1% of all closed sales, and there were no short sales. That means that 99.9% of all sales were good ol’ fashioned sellers with equity.
A Jump in Demand
Orange County Housing Report: A Jump in Demand
September 30, 2024
After topping 7.5% in April, mortgage rates have declined to the low sixes and have remained there with duration, paving the way for an uncharacteristic late September rise in demand.
Lower Rates Impact Demand
Demand jumped by 10% in the past couple of weeks.
Everyone is always looking for a good deal. With Thanksgiving around the corner, many holiday shoppers will look to Black Friday and Cyber Monday for deep discount savings. Inevitably, in the early morning hours on the day after Thanksgiving, a long line of eager customers will arrive hours before stores open their doors. With the cost of living increases since the pandemic, consumers are looking for huge savings, especially on high-ticket items.
Mortgage rates have been stubbornly high this year. For most of 2024, they have remained above 7%, even topping 7.5% several times in April. They have been falling ever since, dropping below 7% in July and below 6.5% at the end of August. Now that interest rates have been dancing in the low sixes for several weeks, it is as if the entire housing industry suddenly went on sale with deep discounts. Buyers who had paused their hunt for a home are coming off the sidelines and reviving their search. Just as consumers look for deals on Black Friday and Cyber Monday, buyers are looking to cash in on favorable rates and significant improvements in affordability.
Ever since the Federal Reserve raised the short-term Federal Funds rate substantially a couple of years ago, rates climbed during the Autumn Market and hit their annual heights, reaching 7.37% in 2022 and eclipsing 8% in 2023. Affordability eroded, and demand slowed. But not this year. Rates recently dropped to their lowest level since February 2023, a considerable improvement from 7.5% just five months ago. They have persisted at these lower levels for several weeks now. This has resulted in a jump in demand and a noticeable drop in the Expected Market Time.
Mortgage rates are currently at 6.21%. For a $1 million home purchase with 20% down, the monthly payment would be $4,905. That is much better than last year’s 7.61% rate and monthly payment of $5,654. Today’s payment is $749 per month lower, or nearly a $9,000 yearly savings. It is a $252 monthly savings, or $3,024 annually, compared to two years ago when rates were at 6.69% and climbing.
With a significant improvement in home affordability, buyer demand (a snapshot of the number of new pending sales over the prior month) jumped from 1,413 two weeks ago to 1,554 days today, up 141 pending sales or 10%. It was the first late September rise in demand since 2012. Last year, during the same two-week period, demand dropped by 4%, shedding 60 pending sales. Two years ago, it plunged by 158 or 9%. The 3-year average before COVID (2017 to 2019), when housing was predictable year in and year out, was a drop in demand by 4%.
Combine the surge in demand with a slight drop in the inventory, down 1% in the past couple of weeks, and the market is uncharacteristically heating up amid the Autumn Market. The Expected Market Time (the number of days it takes to sell all Orange County listings at the current buying pace) sank from 78 to 71 days in the past couple of weeks, its largest drop at this time of year since tracking began twenty years ago.
Demand has been subdued, bouncing along a shallow bottom since October 2022. It has not fluctuated much and has remained flat, at bare-bone, inherent levels. There are always buyers in every market regardless of where rates climb. Yet, more buyers enter the market as mortgage rates improve and persist at lower levels. The lower rates fall, the more affordability recuperates, resulting in considerable improvements in demand. Currently, mortgage rates are knocking on the door of falling into the fives for the first time since August 2022.
This unconventional shift in demand and subsequent drop in the Expected Market Time is a "green shoot" for the Orange County housing market, a positive data point illustrating a new path to an eventual recovery in the lack of home sales. Due to very low demand, closed sales have also been down substantially. Not many homes have exchanged hands.
There is pressure on mortgage rates to fall further with a cooling economy and a slowing job market. Expect demand to continue to push higher in year-over-year comparisons and for closed sales to rise as well.
Active Listings
The active inventory may have reached a peak two weeks ago.
The active listing inventory decreased by 29 homes in the past two weeks, down 1%, and now sits at 3,666, its first drop since March. This drop may be the beginning of a steady fall in the inventory for the remainder of the year, indicating that a peak was reached a couple of weeks ago in mid-September. Nonetheless, the peak is late, typically occurring between July and August. Last year’s peak occurred in November, even later. The earlier the peak, the further the inventory falls for the remainder of the year. Orange County housing peaked because of the sharp rise in demand, which ultimately chipped away at the inventory. During the Autumn Market, fewer homes are placed on the market compared to the spring and summer months. The number of sellers coming on the market declines further each month, with the fewest in December followed by the second-fewest in November. The slow, steadfast fall during the autumn changes to a rapid decline during the holidays, from Thanksgiving to the New Year. The inventory drops to its lowest level by year’s end.
Last year, the inventory was 2,340 homes, 36% lower, or 1,326 fewer. The 3-year average before COVID (2017 through 2019) was 6,400, an additional 2,734 homes, or 75% more. This difference has been diminishing.
Homeowners continue to “hunker down” in their homes, unwilling to move due to their current underlying, locked-in, low fixed-rate mortgage. It became a crisis once rates skyrocketed higher in 2022. For August, 2,454 new sellers entered the market in Orange County, 1,083 fewer than the 3-year average before COVID (2017 to 2019), 31% less. Last August, there were 2,154 new sellers, 12% fewer than this year. More sellers are opting to sell compared to the previous year.
Demand
Demand jumped by 10% in the past couple of weeks.
Demand, a snapshot of the number of new pending sales over the prior month, jumped from 1,413 to 1,554 in the past couple of weeks, up 141 pending sales, or 10%, its largest increase since February and its highest level since July. A substantial rise at this time of the year is unprecedented and is a direct result of a significant increase in affordability. Even though mortgage rates already had the Federal Reserve half-of-a-percent cut in the short-term rate baked into long-term mortgage rates before their announcement a couple of weeks ago, many buyers waited for the news before writing an offer to purchase. With the Federal Reserve initiating its rate-cut cycle, many buyers have decided to cash in on the improving mortgage rate environment. As long as mortgage rates hover around today’s current levels or drop even lower, expect demand to continue to improve and outpace last year’s demand levels.
As the Federal Reserve has indicated, watching all economic releases for signs of slowing is essential. These releases can potentially move mortgage rates higher or lower, depending on how they stack up compared to market expectations. This week is jobs week, which includes the number of job openings, wages, the number of jobs created or lost, and unemployment. This week will be the most consequential week for rates and will set the tone for the remainder of October.
Last year, demand was 1,414, down 140 pending sales or 9%. The 3-year average before COVID (2017 to 2019) was 2,262 pending sales, 46% more than today, or an additional 708.
With supply falling and demand surging higher, the Expected Market Time (the number of days it takes to sell all Orange County listings at the current buying pace) decreased from 78 to 71 days in the past couple of weeks. Last year, it was 50 days, faster than today. The 3-year average before COVID was 86 days, slower than today.
Luxury End
The luxury market improved slightly in the past couple of weeks.
In the past couple of weeks, the luxury inventory of homes priced above $2 million (the top 10% of the Orange County housing market) increased from 1,198 to 1,207 homes, up nine or 1%. Luxury demand increased by eight pending sales, up 3%, and now sits at 247. With demand rising faster than supply, the Expected Market Time for luxury homes priced above $2 million decreased from 150 to 147 days, its strongest reading since the start of July. Nonetheless, at 147 days, the luxury market is considerably slower than the lower ranges. For homes priced below $2 million, the Expected Market Time is 56 days.
Year over year, the active luxury inventory is up by 418 homes or 53%, and luxury demand is up by 56 pending sales or 29%. Last year’s Expected Market Time was 124 days, a bit faster than today.
In the past two weeks, the expected market time for homes priced between $2 million and $4 million decreased from 111 to 108 days. For homes priced between $4 million and $6 million, the Expected Market Time decreased from 257 to 199 days. For homes priced above $6 million, the Expected Market Time increased from 295 to 391 days. At 391 days, a seller would be looking at placing their home into escrow around October 2025.
Orange County Housing Summary
• The active listing inventory in the past couple of weeks decreased by 29 homes, down 1%, and now sits at 3,666, its first drop since March and a strong indicator that a peak was reached a couple of weeks ago. In August, 31% fewer homes came on the market compared to the 3-year average before COVID (2017 to 2019), 1,083 less. Yet, 300 more sellers came on the market this August compared to August 2023. Last year, there were 2,340 homes on the market, 1,326 fewer homes, or 36% less. The 3-year average before COVID (2017 to 2019) was 6,400, or 75% extra.
• Demand, the number of pending sales over the prior month, jumped by 141 pending sales in the past two weeks, up 10%, and now totals 1,554, its largest increase since the start of February and its highest level since the beginning of July. Last year, there were 1,414 pending sales, 9% fewer. The 3-year average before COVID (2017 to 2019) was 2,262, or 46% more.
• With supply falling slightly and demand surging higher, the Expected Market Time, the number of days to sell all Orange County listings at the current buying pace, decreased from 78 to 71 days in the past couple of weeks, its most significant improvement since the start of February. It was 50 days last year, faster than today. The 3-year average before COVID (2017 to 2019) was 86 days, slower than today.
• In the past two weeks, the Expected Market Time for homes priced below $750,000 decreased from 50 to 49 days. This range represents 16% of the active inventory and 24% of demand.
• The Expected Market Time for homes priced between $750,000 and $1 million decreased from 54 to 47 days. This range represents 14% of the active inventory and 21% of demand.
• The Expected Market Time for homes priced between $1 million and $1.25 million decreased from 62 to 50 days. This range represents 11% of the active inventory and 16% of demand.
• The Expected Market Time for homes priced between $1.25 million and $1.5 million decreased from 75 to 66 days. This range represents 11% of the active inventory and 12% of demand.
• The Expected Market Time for homes priced between $1.5 million and $2 million decreased from 103 to 84 days. This range represents 15% of the active inventory and 12% of demand.
• In the past two weeks, the expected market time for homes priced between $2 million and $4 million decreased from 111 to 108 days. For homes priced between $4 million and $6 million, the Expected Market Time decreased from 257 to 199 days. For homes priced above $6 million, the Expected Market Time increased from 295 to 391 days.
• The luxury end, all homes above $2 million, account for 33% of the inventory and 15% of demand.
• Distressed homes, both short sales and foreclosures combined, comprised only 0.1% of all listings and 0.1% of demand. Only four foreclosures and one short sale are available today in Orange County, with five total distressed homes on the active market, down two from two weeks ago. Last year, six distressed homes were on the market, similar to today.
• There were 1,877 closed residential resales in August, down 5% compared to July 2023’s 1,979 and down 8% from July 2024. The sales-to-list price ratio was 99.0% for Orange County. Foreclosures accounted for 0.1% of all closed sales, and there were no short sales. That means that 99.9% of all sales were good ol’ fashioned sellers with equity.
Go for Gold – Don’t Wait
Orange County Housing Report: Go for Gold – Don’t Wait
August 5, 2024
Mortgage rates have plunged from 7.5% in April to 6.34% today, opening up a window of opportunity for buyers who should not wait.
A Window of Opportunity
Since rates have dropped in anticipation of future Federal Reserve rate cuts, now is the ideal time, and waiting will prove to be the incorrect strategy.
Olympic gold medal winners perfect their game plans and execute precise timing and strategy to succeed. On the track, many runners wait too long for their final push and cross the finish line out of medal contention. The commentators exclaim that they “should have gone sooner.” The athletes are left second-guessing themselves, wishing they had not waited.
Many buyers have been sitting on the sidelines, waiting for rates to come down. Now that rates have plummeted from 7.5% in April to 6.34% today, according to Mortgage News Daily, many buyers wonder if they should pull the trigger and purchase now or wait for rates to fall further. Sitting on the fence and waiting will prove to be the incorrect strategy, leaving many to wish that they had bought sooner.
Long-term, 30-year mortgage rates move ahead of the Federal Reserve Rate cuts. The Federal Reserve (Fed) has not cut rates once since the historical increases from 2022 through 2023, yet mortgage rates have moved all over the place, even eclipsing 8% last October. The movement is based on where investors believe the direction that the Fed’s short-term Federal Funds rate policy will move.
With inflation continuing to ease, the job market cooling, and unemployment rising, it is becoming increasingly clear that the FED is too restrictive, and they will need to cut rates when they meet in mid-September. As a result, in less than two weeks, mortgage rates have plunged from 6.91% to 6.34% today. September’s rate cut, currently projected to be a 0.5% snip by Wall Street, is already baked into today’s mortgage rates. When they do trim the Federal Funds rate in September, do NOT expect mortgage rates to drop another 0.5%. This is where buyers sitting on the sidelines are mistaken. They hear that the Fed will cut, but the headlines and news refer to the short-term Federal Funds rate, not long-term mortgage rates. When they do cut, expect credit card, automobile, and equity lines of credit rates to all drop, which are all tied to the Federal Funds rate, but NOT long-term rates utilized in purchasing homes.
Can long-term rates go lower? Yes, they can. But today's mortgage rates are already factoring in future cuts totaling 1.25%. If the economy cools even more, which the trends in the data currently support, expect rates to fall further next year. Yet, with the recent plunge, affordability has improved dramatically. More potential buyers qualify. Buyers already in the marketplace have witnessed their purchasing power increase; they can now afford a much higher-priced home. With improving affordability, demand will rise just as the inventory is about to reach its summer peak and begin to fall. As demand increases and supply falls, market times will drop. There will be more buyer competition, and values will rise again from here.
For a buyer looking to purchase a $1 million home today with 20% down and a 6.5% rate, the principal and interest payment would be $5,057. Due to a further constrained inventory and increased demand, values are anticipated to rise at least 5%. That $1 million home would appreciate to $1,050,00. Even if rates drop to 6%, the monthly payment would be $5,036, nearly identical to today’s payment at 6.5%. It is only $21 less per month or $252 annually. In waiting, the buyer loses out on $50,000 appreciation and is looking at a $10,000 additional down payment.
What if 30-year rates drop to 5.5%? Isn’t it better to wait until that occurs? There is a rule of thumb when it comes to refinancing: when mortgage rates drop by 1% or more from the current locked-in, fixed rate, then it is an excellent time to refinance. The buyer that purchases a $1 million home today could refinance next year if rates fall to 5.5%. The monthly payment would drop from $5,057 to $4,542, a savings of $515 every month or $6,180 annually.
For the buyer who waits to purchase until next year, the $1 million home is anticipated to appreciate at least 5% to $1,050,000. The monthly payment would be $4,769. That is $227 per month higher or $2,724 annually compared to purchasing now and refinancing once rates drop to 5.5%. In addition, waiting requires an extra $10,000 in down payment, and the buyer once again misses out on $50,000 in appreciation.
Today is already one of the best times to purchase in the past couple of years. The Orange County inventory is at 3,426, up 28% or 951 homes compared to last year. There are way more choices in every price range. Demand, a snapshot of the number of new pending sales over the prior month, is at 1,530, down 3% compared to last year, 50 fewer pending sales. With much higher inventory levels and demand on par with the previous year, the Expected Market Time, the number of days it takes to sell all Orange County listings at the current buying pace, is 67 days, much slower than last year’s 47-day speed. As rates remain at these low levels with duration, expect the inventory to fall, demand to rise, and the Expected Market Time to drop for the remainder of the year.
The most favorable condition for buyers is NOW. Just like so many Olympic athletes crossing the finish line first, it is time for buyers to make that gold medal decision and pull the trigger now. Do not wait.
Active Listings
The active inventory increased by 2% in the past couple of weeks.
The active listing inventory increased by 55 homes in the past two weeks, up 2%, and now sits at 3,426, its highest level since November 2022. With rates dropping and demand anticipated to accelerate in the coming weeks, expect the Orange County inventory to reach its annual peak at its typical time between July and August. As the inventory is reaching its peak, the inventory climbs at a much slower pace. After reaching its peak, expect the inventory to fall slowly. As demand accelerates with easing rates, the inventory has a high likelihood of dropping at a faster pace than usual. Combine the Autumn Market drop with the end-of-the-year Holiday Market plunge, and 2024 inventory levels could reach very anemic levels upon ushering in a New Year.
Last year, the inventory was 2,475 homes,28%lower, or 951 fewer. The 3-year average before COVID (2017 through 2019) was 6,753, an additional 3,327 homes, or 97% more, nearly double the current level. This difference illustrates that the inventory crisis is still impacting Orange County housing.
Homeowners continue to “hunker down” in their homes, unwilling to move due to their current underlying, locked-in, low fixed-rate mortgage. It became a crisis once rates skyrocketed higher in 2022. For July, 2,711 new sellers entered the market in Orange County, 996 fewer than the 3-year average before COVID (2017 to 2019), 27% less. Last July, there were 2,270 new sellers, 16% fewer than this year. More sellers are opting to sell compared to last year.
Demand
Demand remained unchanged in the past couple of weeks.
Demand, a snapshot of the number of new pending sales over the prior month, decreased from 1,531 to 1,530 in the past couple of weeks, down one pending sale, nearly unchanged. Demand has remained at incredibly anemic, inherent levels since October 2022. There are always buyers willing to purchase. With the high mortgage rate environment, rates stuck around 7% or higher for the better part of a year now, very few buyers have been willing to participate. That is why 2024 demand levels have remained very close to last year’s. Yet, since the end of July, rates have dropped from 6.91% to a low of 6.34% today, according to Mortgage News Daily. That is the lowest rate in 16 months since April 2023. A year ago, rates rose from 7% at the end of July to 8% in October. This year, mortgage rates are improving affordability and will ultimately drive more demand. Expect demand to rise in the coming weeks, instigated by more buyers who now qualify and an increase in buyers’ purchasing power. Buyers who were already looking to purchase a home can suddenly purchase a higher priced home with no change in payment. Expect more buyer competition chasing a falling supply for the remainder of the year.
As the Federal Reserve has indicated, watching all economic releases for signs of slowing is essential. These releases can potentially move mortgage rates higher or lower, depending on how they stack up compared to market expectations. There are not too many economic releases until next week, when the Consumer Price Index will be released on Wednesday, and U.S. retail sales will be released on Thursday. Both have a high potential to move mortgage rates.
Last year, demand was 1,580, 3% more than today, or 50 additional pending sales. The 3-year average before COVID (2017 to 2019) was 2,630 pending sales, 72% more than today, or an additional 1,100.
With supply rising and demand unchanged, the Expected Market Time (the number of days it takes to sell all Orange County listings at the current buying pace) increased from 66 to 67 days in the past couple of weeks. Last year, it was 47 days, faster than today. The 3-year average before COVID was 78 days, a bit slower than today.
Luxury End
The luxury market has not changed much in the past couple of weeks.
In the past couple of weeks, the luxury inventory of homes priced above $2 million increased from 1,188 to 1,206 homes, up 18 or 2%, the highest level since October 2019. Luxury demand increased by six pending sales, up 3%, and now sits at 232. With demand rising slightly faster than demand, the Expected Market Time for luxury homes priced above $2 million decreased from 158 to 156 days. The luxury market feels exceptionally sluggish compared to the lower ranges. The higher the price, the longer it takes to secure success. Typically, financial market volatility impacts the velocity of luxury. If Wall Street does not recover quickly, expect the luxury market to slow further.
Year over year, the active luxury inventory is up by 413 homes or 52%, and luxury demand is up by 16 pending sales or 7%. Last year’s Expected Market Time was 110 days, much faster than today.
In the past two weeks, the expected market time for homes priced between $2 million and $4 million decreased from 116 to 114 days. For homes priced between $4 million and $6 million, the Expected Market Time increased from 156 to 170 days. For homes priced above $6 million, the Expected Market Time increased from 630 to 656 days. At 656 days, a seller would be looking at placing their home into escrow around May 2026.
Orange County Housing Summary
· The active listing inventory in the past couple of weeks increased by 55 homes, up 2%, and now sits at 3,426, its highest level since November 2022. In July, 27% fewer homes came on the market compared to the 3-year average before COVID (2017 to 2019), 996 less. Yet, 441 more sellers came on the market this July compared to July 2023. Last year, there were 2,475 homes on the market, 951 fewer homes, or 28% less. The 3-year average before COVID (2017 to 2019) was 6,753, or 97% extra, nearly double.
· Demand, the number of pending sales over the prior month, decreased by one pending sale in the past two-week, nearly unchanged, and now totals 1,530, still its lowest level since February. Last year, there were 1,580 pending sales, 3% more. The 3-year average before COVID (2017 to 2019) was 2,630, or 72% more.
· With supply climbing and demand unchanged, the Expected Market Time, the number of days to sell all Orange County listings at the current buying pace, increased from 66 to 67 days in the past couple of weeks. It was 47 days last year, faster than today. The 3-year average before COVID (2017 to 2019) was 78 days, a bit slower than today.
· In the past two weeks, the Expected Market Time for homes priced below $750,000 decreased from 47 to 45 days. This range represents 15% of the active inventory and 23% of demand.
· The Expected Market Time for homes priced between $750,000 and $1 million decreased from 46 to 42 days. This range represents 13% of the active inventory and 22% of demand.
· The Expected Market Time for homes priced between $1 million and $1.25 million increased from 46 to 49 days. This range represents 11% of the active inventory and 15% of demand.
· The Expected Market Time for homes priced between $1.25 million and $1.5 million increased from 52 to 57 days. This range represents 10% of the active inventory and 12% of demand.
· The Expected Market Time for homes priced between $1.5 million and $2 million increased from 65 to 76 days. This range represents 15% of the active inventory and 13% of demand.
· In the past two weeks, the expected market time for homes priced between $2 million and $4 million decreased from 116 to 114 days. For homes priced between $4 million and $6 million, the Expected Market Time increased from 156 to 170 days. For homes priced above $6 million, the Expected Market Time increased from 630 to 656 days.
· The luxury end, all homes above $2 million, account for 36% of the inventory and 15% of demand.
· Distressed homes, both short sales and foreclosures combined, comprised only 0.3% of all listings and 0.3% of demand. Only six foreclosures and three short sales are available today in Orange County, with nine total distressed homes on the active market, up one from two weeks ago. Last year, seven distressed homes were on the market, similar to today.
· There were 1,809 closed residential resales in June, down 9% compared to June 2023’s 1,993 and down 15% from May 2024. The sales-to-list price ratio was 100.3% for Orange County. Short sales accounted for 0.1% of all closed sales and no foreclosures. That means that 99.89% of all sales were good ol’ fashioned sellers with equity.